

Earnings position
Revenue and income
| T019 | REVENUE AND INCOME | ||
|---|---|---|---|
| 2024 | 2023 | Change | |
| in €m | in €m | in % | |
| Traffic revenue | 31,439 | 29,926 | 5 |
| Other revenue | 6,142 | 5,516 | 11 |
| Total revenue | 37,581 | 35,442 | 6 |
| Changes in inventories and other own work capitalised | 954 | 727 | 31 |
| Other operating income 1) | 2,007 | 2,260 | -11 |
| Total operating income | 40,542 | 38,429 | 5 |
| 1) Without non-current asset write-backs, reversals of non-operational provisions and book gains. | |||
Traffic increased, traffic revenue up 5%
Driven by ongoing strong demand for air travel, the Lufthansa Group Passenger Airlines expanded their capacity (available seat-kilometres) by 9% year on year in 2024. Capacity was up 12% on the previous year in the first quarter, up 11% in the second quarter, up 6% in the third quarter and up 5% in the fourth quarter. Over the reporting year as a whole, capacity was 91% of the pre-crisis level reported in 2019 (previous year: 84%).
The number of flights increased by 5% year-on-year in 2024. Sales (revenue seat-kilometres) grew by 9%. The airlines in the Lufthansa Group carried around 131 million passengers in total in the 2024 financial year, 7% more than in the previous year. The passenger load factor was up by 0.2 percentage points to 83.1%. Traffic revenue in the passenger business picked up by 4% to EUR 27,869m (previous year: EUR 26,701m). Lower yields had a negative impact, however.
In the Lufthansa Group’s cargo business, capacity (available cargo tonne-kilometres) was 10% higher than in the previous year due to the delivery of a B777F freighter and increased belly capacities in the Passenger Airlines segment. Sales (revenue cargo tonne-kilometres) climbed by 14% compared with the previous year. The cargo load factor was up 1.8 percentage points to 58.2%. Traffic revenue in the cargo business grew by 11% to EUR 3,569m due to higher sales despite lower yields (previous year: EUR 3,225m).
Overall traffic revenue for Lufthansa Group airlines increased in the reporting year by 5% to EUR 31,439m year-on-year (previous year: EUR 29,926m).
Further information on the regional breakdown of traffic revenue for the Passenger Airlines and Logistics segments can be found in the chapters Business segments.
Other revenue up 11%
Other revenue improved by 11% year-on-year to EUR 6,142m (previous year: EUR 5,516m). This was mainly due to the increase in external business activities and the associated higher revenues in the MRO business segment.
Revenue up 6%
Revenue, which consists of traffic revenue plus other revenue, increased by 6% in the 2024 financial year to EUR 37,581m (previous year: EUR 35,442m).
Further information on the regional distribution of revenue can be found in the Notes, Notes to the segment reporting.
Changes in inventory and work performed by entity and capitalised went up by 31% to EUR 954m due to the higher volume of major engine maintenance events (previous year: EUR 727m).
Due in particular to lower foreign exchange gains and income from the reversal of provisions and accruals, other operating income went up by 11% to EUR 2,007m (previous year: EUR 2,260m).
Total operating income thus increased by 5% in the 2024 financial year to EUR 40,542m (previous year: EUR 38,429m).
Expenses
Cost of materials and services up 10% due to increased business activities and inflation-related cost increases
The cost of operating materials and services for the Lufthansa Group in the 2024 financial year was 10% higher than in the previous year at EUR 22,393m (previous year: EUR 20,363m). The increase was driven by additional business activities and cost inflation.
Within the cost of materials and services, fuel expenses decreased by 2% to EUR 7,785m (previous year: EUR 7,931m). This decline is based on lower prices for crude oil and jet crack (the price difference between crude oil and kerosene), which was partly offset by higher consumption. The result of price hedging was EUR -139m (previous year: EUR -172m).
Expenses for other raw materials, consumables and supplies, and purchased goods went up by 20% to EUR 3,260m (previous year: EUR 2,713m), particularly in the MRO business segment, due to increased business activity and higher purchasing prices as well as higher expenses for emissions certificates.
Fees and charges swelled by 12% to EUR 5,020m in the reporting period (previous year: EUR 4,487m), primarily due to business growth and fee increases at airports.
Expenses for external MRO services increased by 24% to EUR 2,600m (previous year: EUR 2,104m), primarily due to high capacity utilisation at Lufthansa Technik, which resulted in greater use of external MRO service providers.
As passenger business picked up, there was a 17% increase in expenses for in-flight services, which came to EUR 1,144m (previous year: EUR 980m).
Expenses for passenger assistance in connection with flight irregularities due to strikes and operational difficulties at German airports were up 34% at EUR 364m (previous year: EUR 271m). Direct compensation payments to passengers for flight delays and cancellations, which are recognised as revenue reductions, increased by 110% to EUR 479m (previous year: EUR 228m). In total, expenses and compensation payments went up by 69% year-on-year to EUR 843m (previous year: EUR 499m).
Operating staff costs up 8%
Operating staff costs of EUR 8,992m in the reporting year were 8% higher than in the previous year (previous year: EUR 8,310m). This upward step was due in particular to the 7% expansion in the headcount (adjusted for the effects of the sale of the catering business in 2023), wage and salary increases under collective agreements and one-off payments. By contrast, accrued variable remuneration components decreased.
Depreciation and amortisation up by 5%
Depreciation and amortisation amounted to EUR 2,337m in the reporting year and were thus 5% higher than in the previous year (previous year: EUR 2,228m). This mainly related to aircraft and reserve engines (EUR 1,867m, previous year: EUR 1,764m).
Other operating expenses up by 6%
Other operating expenses rose by 6% to EUR 5,375m (previous year: EUR 5,059m) in particular due to increased sales and marketing costs and higher travel expenses for crew following the expansion of flight operations, and higher other servicing and maintenance expenses.
Operating expenses up by 9% in total
Overall, operating expenses for the Lufthansa Group rose by 9% in the 2024 financial year to EUR 39,097m (previous year: EUR 35,960m).
| T020 | EXPENSES | |||
|---|---|---|---|---|
| 2024 | 2023 | Change | Percentage of operating expenses |
|
| in €m | in €m | in % | in % | |
| Cost of materials and services | 22,393 | 20,363 | 10 | 57 |
| of which fuel | 7,785 | 7,931 | -2 | 20 |
| of which fees | 5,020 | 4,487 | 12 | 13 |
| of which external MRO services | 2,600 | 2,104 | 24 | 7 |
| of which charter expenses | 1,073 | 878 | 22 | 3 |
| Staff costs1) | 8,992 | 8,310 | 8 | 23 |
| Depreciation and amortisation2) | 2,337 | 2,228 | 5 | 6 |
| Other operating expenses3) | 5,375 | 5,059 | 6 | 14 |
| of which staffrelated expenses | 1,029 | 935 | 10 | 3 |
| of which rental and maintenance expense | 655 | 617 | 6 | 2 |
| Total operating expenses | 39,097 | 35,960 | 9 | 100 |
| 1) Without past service cost / plan settlement. T022. 2) Without impairment loss. T022. 3) Without book losses and write-downs on assets held for sale. T022. |
||||
Earnings performance
Adjusted EBIT down to EUR 1.6bn
The operating result from equity investments fell in the reporting year by 6% to EUR 200m (previous year: EUR 213m). This development is due largely to lower earnings from the Sun Express joint venture and lower dividend payments within the Logistics business segment.
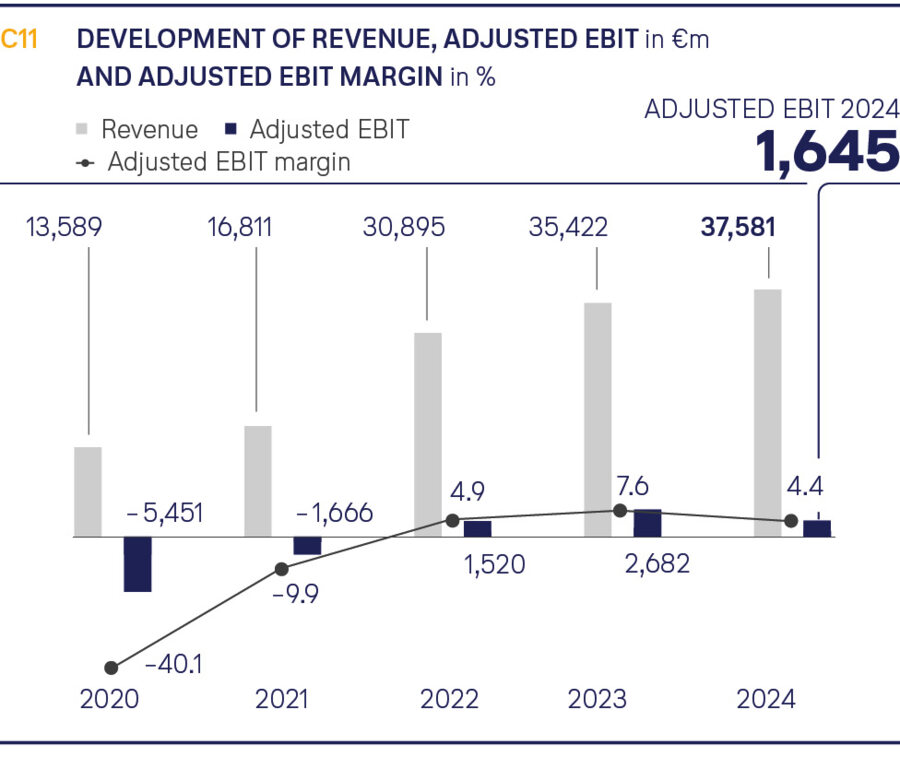
Adjusted EBIT for the Lufthansa Group fell by 39% in the 2024 financial year to EUR 1,645m (previous year: EUR 2,682m). The strikes at various Lufthansa Group companies and external system partners in the first quarter had a direct and indirect negative impact on earnings of around EUR 450m. The Adjusted EBIT margin, i.e. the ratio of Adjusted EBIT to revenue, contracted by 3.2 percentage points to 4.4% (previous year: 7.6%).
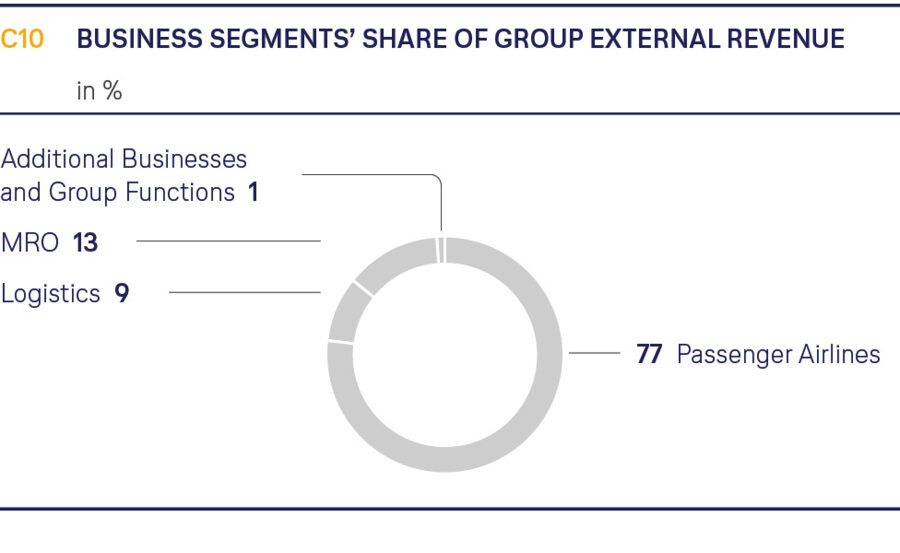
Adjusted EBIT in the Passenger Airlines business segment amounted to EUR 1,046m (previous year: EUR 2,033m), in particular due to a EUR 948m drop in earnings at Lufthansa Airlines. Adjusted EBIT in the Logistics segment increased to EUR 251m (previous year: EUR 219m). With an Adjusted EBIT of EUR 635m, the MRO segment achieved another record result (previous year: EUR 628m). The other Group companies, which under IFRS 8 do not require separate reporting, and the Group Functions reduced the Group’s Adjusted EBIT by a total of EUR -173m (previous year: EUR -206m).
EBIT of EUR 1.7bn
Based on EBIT and as a key performance indicator, Adjusted EBIT is adjusted for clearly defined, non-plannable earnings components for the purpose of better comparability. Financial strategy and value-based management.
EBIT amounted to EUR 1,731m in the 2024 financial year (previous year: EUR 2,669m). The difference relative to Adjusted EBIT was therefore EUR 86m (previous year: EUR -13m).
The adjustments consist mainly of book gains of EUR 212m, primarily from the sale of the AirPlus Group (EUR 92m), and sale-and-leaseback transactions for 15 Airbus A320/321s (EUR 99m). A further EUR 52m related to impairment losses on investments and loans in the MRO segment and aircraft held for sale, EUR 24m to staff-related restructuring expenses, EUR 20m to book losses and EUR 20m to earnings effects from changes to pension plans.
The result from operating activities came to EUR 1,542m in the 2024 financial year (previous year: EUR 2,456m).
Financial result comes to EUR 34m
The financial result came to EUR 34m in the 2024 financial year (previous year: EUR -139m). The result from equity investments included in this figure was EUR 189m (previous year: EUR 213m).
Net interest improved to EUR -149m (previous year: EUR -348m). Higher interest income, partly from interest accrued on income tax assets resulting from the audit and the disposal of current securities, was offset by interest expenses that were virtually unchanged.
Other financial items came to EUR -6m (previous year: EUR -4m). Positive effects from the recognition in profit or loss of the convertible bond and current securities were more than offset by ineffective components of the currency hedges and negative valuation effects from financial liabilities in foreign currencies.
Income taxes came to EUR -176m (previous year: EUR -380m). At 11%, the effective tax ratio for continuing operations was below the expected tax rate, due mainly to non-taxable income and tax credits for prior years, which were partly offset by the non-recognition of deferred taxes on tax loss carry-forwards.
The result from continuing operations therefore came to EUR 1,400m (previous year: EUR 1,937m).
The result from discontinued operations of EUR -7m (previous year: EUR -248m) relates to subsequent purchase price adjustments from the sale of the Catering business. In the previous year, the item included the disposal result of EUR -243m for the Catering business.
After taking minority interests of EUR -13m (previous year: EUR -16m) into account, the net profit for the period attributable to the shareholders of Deutsche Lufthansa AG amounted to EUR 1,380m (previous year: EUR 1,673m).
Earnings per share amounted to EUR 1.15 (previous year: EUR 1.40). Notes to the consolidated financial statements, Note 16.
| T021 | PROFIT BREAKDOWN OF THE LUFTHANSA GROUP | ||
|---|---|---|---|
| 2024 | 2023 | Change | |
| in €m | in €m | in % | |
| Operating income | 40,767 | 38,582 | 6 |
| Development of operating expenses | -39,225 | -36,126 | -9 |
| Profit/loss from operating activities | 1,542 | 2,456 | -37 |
| Financial result | 34 | -139 | |
| Profit/loss before income taxes | 1,576 | 2,317 | -32 |
| Income taxes | -176 | -380 | 54 |
| Profit/loss from continuing operations | 1,400 | 1,937 | -28 |
| Profit/loss from discontinued operations | -7 | -248 | 97 |
| Profit/loss after income taxes | 1,393 | 1,689 | -18 |
| Profit/loss attributable to minority interests | -13 | -16 | 19 |
| Net profit/loss attributable to shareholders of Deutsche Lufthansa AG | 1,380 | 1,673 | -18 |
Executive Board and Supervisory Board propose dividend of EUR 0.30 per share
In principle, the Lufthansa Group’s dividend policy is to distribute to its shareholders 20% to 40% of net profit, adjusted for non-recurring gains and losses. One condition for the payment of a dividend is that the net profit for the year as shown in the individual financial statements of Deutsche Lufthansa AG that are drawn up under German commercial law allows for a distribution of the relevant amount. Financial strategy and value-based management, Forecast.
Deutsche Lufthansa AG reported net profit for the year of EUR 372m for the 2024 financial year. Following the transfer of EUR 13m to retained earnings, distributable profit comes to EUR 359m.
In line with the dividend policy, the Executive Board and Supervisory Board of Deutsche Lufthansa AG will table a proposal at the Annual General Meeting on 6 May 2025 to distribute a dividend of EUR 0.30 per share to shareholders for financial year 2024. This represents a total payout of EUR 359m or 26% of net profit for 2024.
| T022 | RECONCILIATION OF RESULTS | |||
|---|---|---|---|---|
| 2024 | 2023 | |||
| in €m | Income statement | Reconciliation of Adjusted EBIT | Income statement | Reconciliation of Adjusted EBIT |
| Total revenue | 37,581 | 35,442 | ||
| Changes in inventories and other own work capitalised | 954 | 727 | ||
| Other operating income | 2,232 | 2,413 | ||
| of which book gains et al. | -212 | - 134 | ||
| of which write-ups on non-current assets | -3 | -4 | ||
| of which reversal of provisions for restructuring/M&A projects and material legal disputes |
-7 | - 12 | ||
| of which extraordinary other income | - 2 | -3 | ||
| Total operating income | 40,767 | -224 | 38,582 | -153 |
| Cost of materials and services | -22,399 | -20,378 | ||
| of which extraordinary cost of materials and services | 6 | 16 | ||
| Staff costs | -9,036 | -8,344 | ||
| of which past service costs/settlement | 20 | 24 | ||
| of which restructuring costs | 24 | 10 | ||
| Depreciation, amortisation and impairment | -2,378 | -2,242 | ||
| of which impairment losses | 41 | 14 | ||
| Other operating expenses | -5,412 | -5,162 | ||
| of which impairment losses on assets held for sale | – | 32 | ||
| of which expenses incurred from book losses | 20 | 33 | ||
| of which expenses for material legal disputes | – | – | ||
| of which expenses for M&A projects | 15 | 39 | ||
| of which extraordinary other operating expenses | 1 | - 2 | ||
| Total operating expenses | -39,225 | 127 | -36,126 | 166 |
| Profit/loss from operating activities | 1,542 | 2,456 | ||
| Result from equity investments | 189 | 213 | ||
| Impairment loss on investments accounted for using the equity method | 11 | – | ||
| EBIT | 1,731 | 2,669 | ||
| Total amount of Adjusted EBIT reconciliation | - 86 | 13 | ||
| Adjusted EBIT | 1,645 | 2,682 | ||
| Depreciation and amortisation | 2,337 | 2,228 | ||
| Adjusted EBITDA | 3,982 | 4,910 | ||